Reports & analytics
The Reports hub is where marks become documents: branded report cards, class broadsheets, rankings, progress reports, transcripts and newsletters. This tutorial covers the whole area — the one-off setup, the term-end generation flow, and every report type.
1. The Reports hub
Open Assessment Reports in the menu. The hub shows your readiness at a glance — registered students, assessments created, the current exam — plus a guided Start Here checklist and a recommended next step.
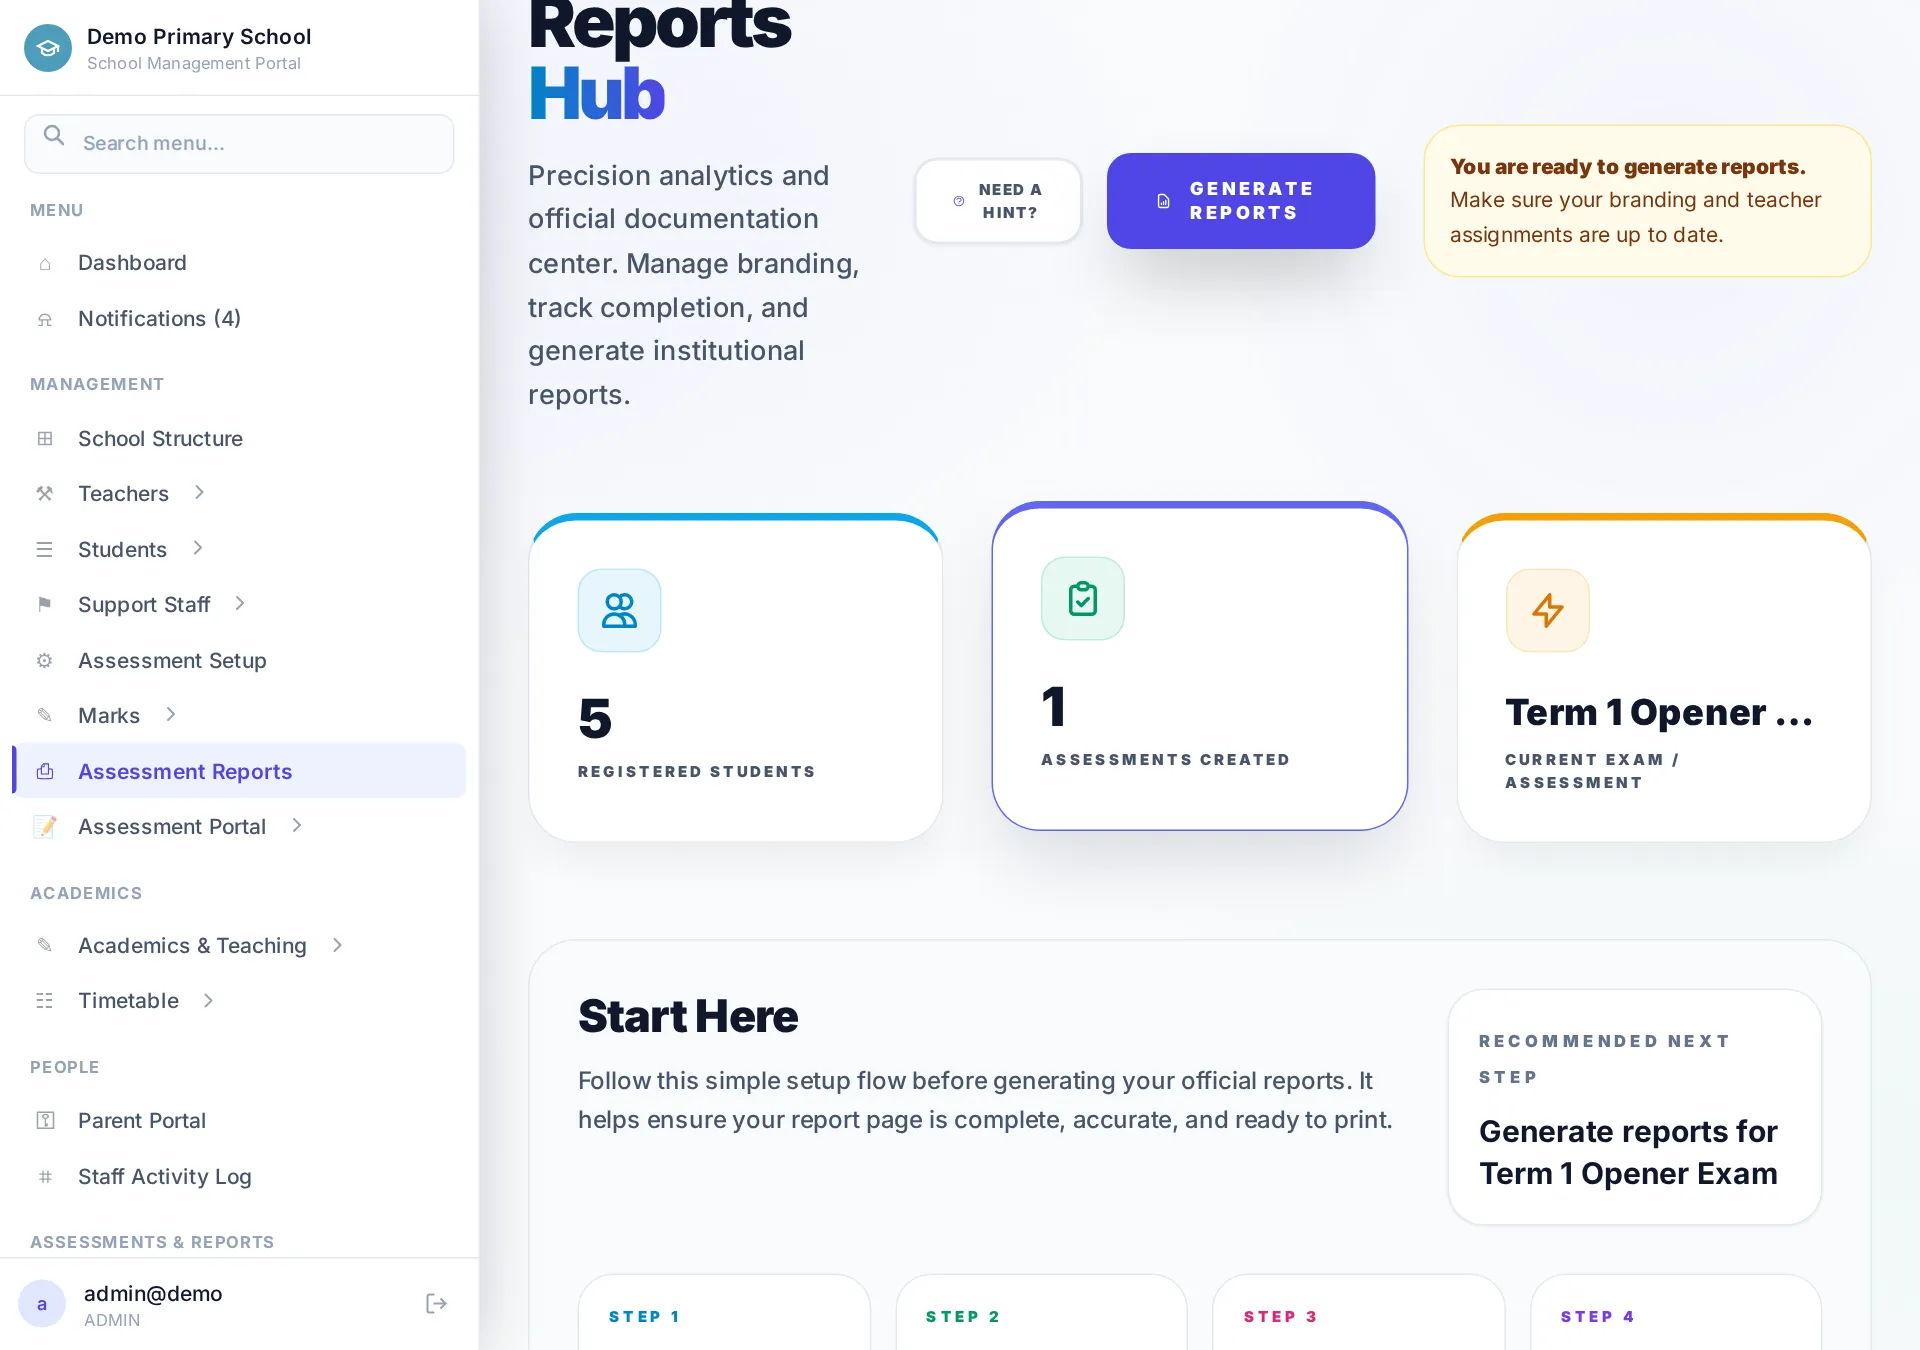
The checklist matters: report cards only assemble correctly when your grade structure, subjects, teacher assignments, marks and branding are all in place. Anything missing is flagged before you waste a generation run.
2. Branding your documents first
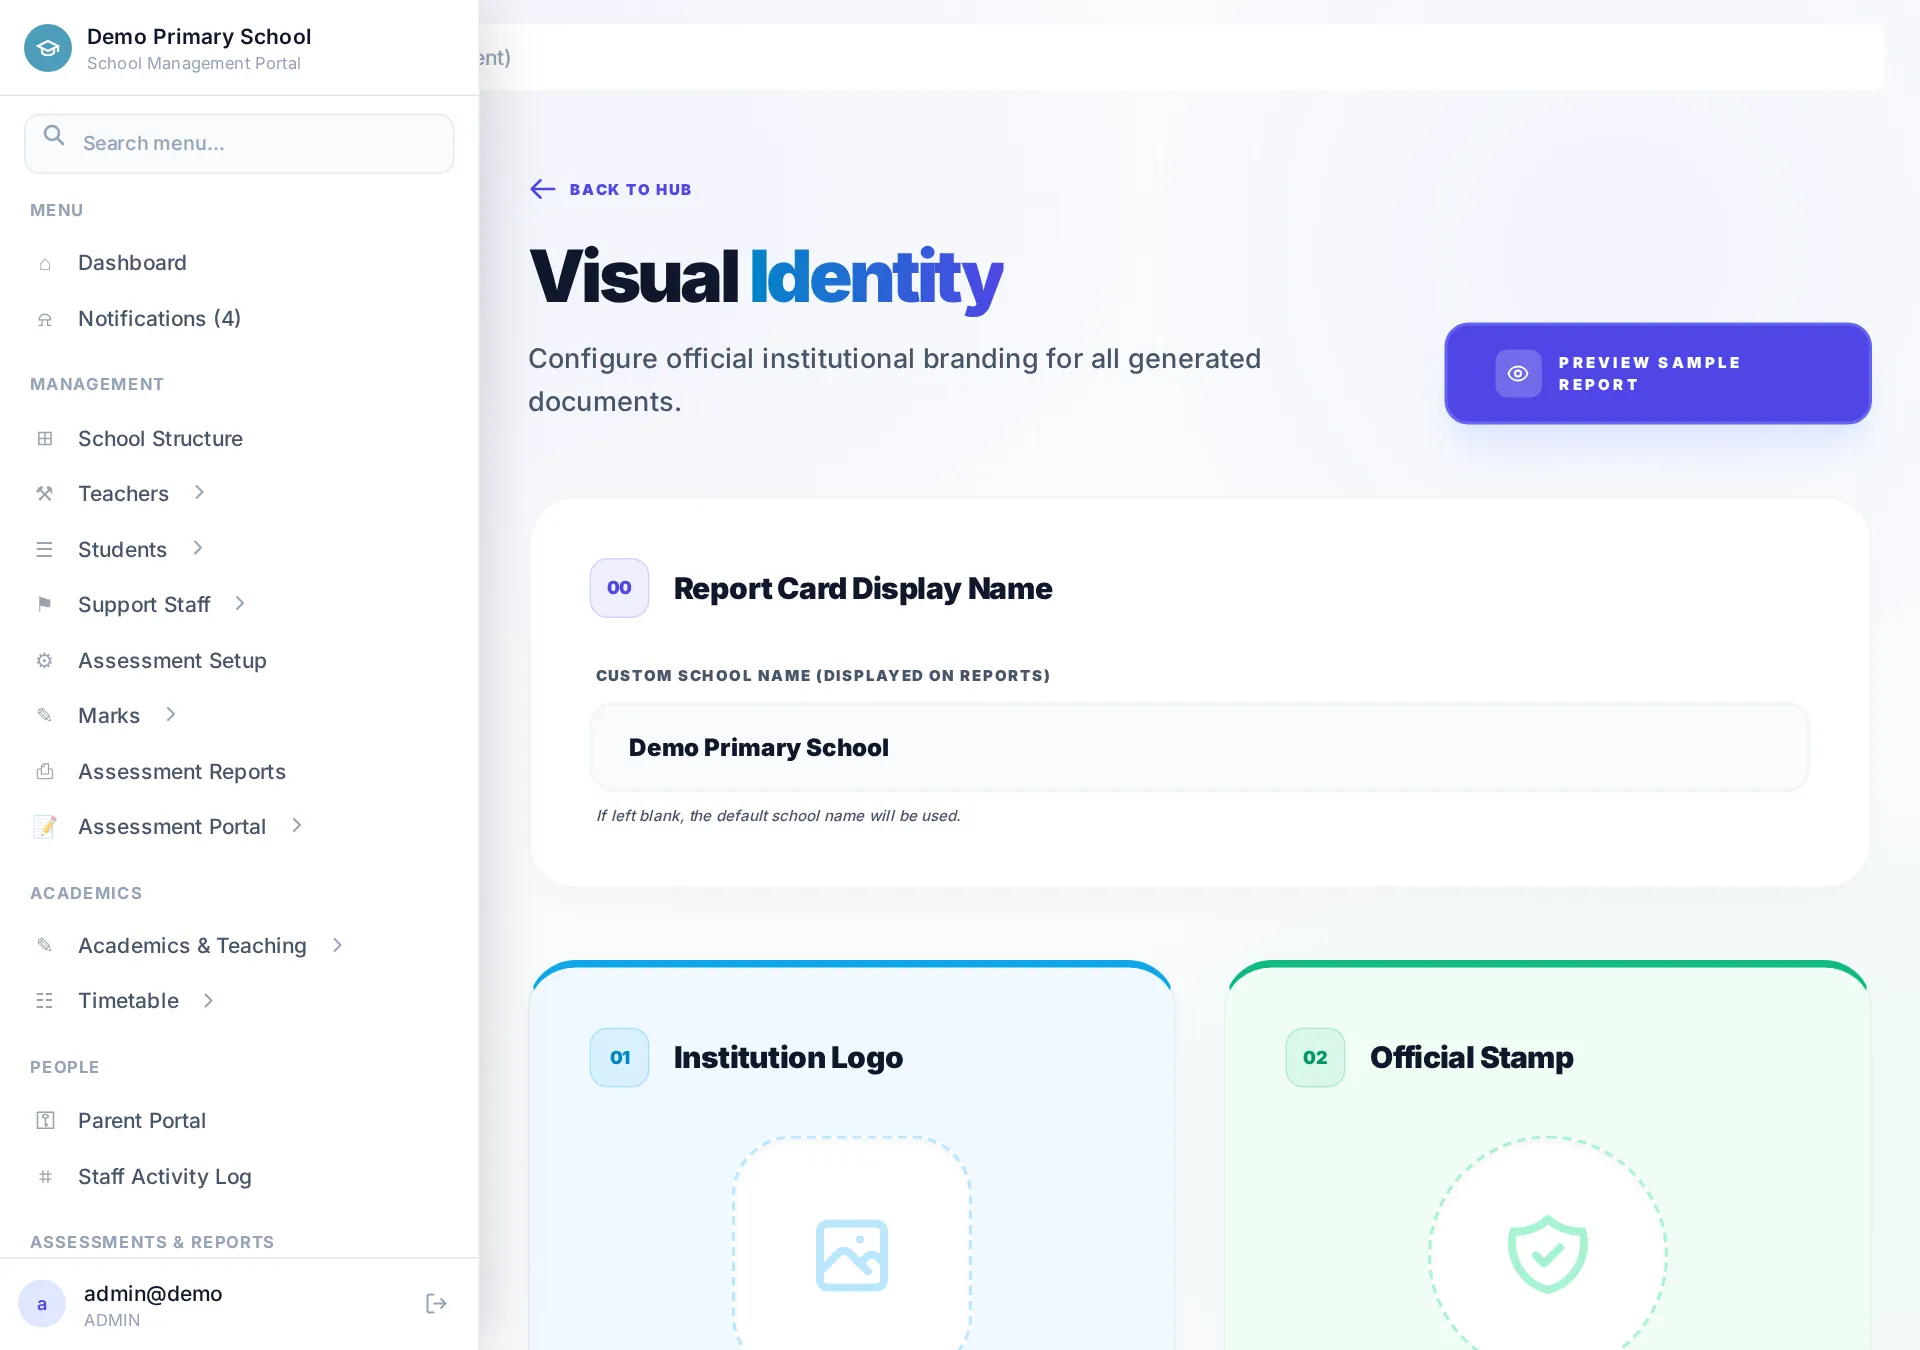
Before your first run, visit Reports → Branding. This is where the school logo, colours, motto and signature block come from — they appear on report cards, transcripts, newsletters and certificates.
3. Generating report cards
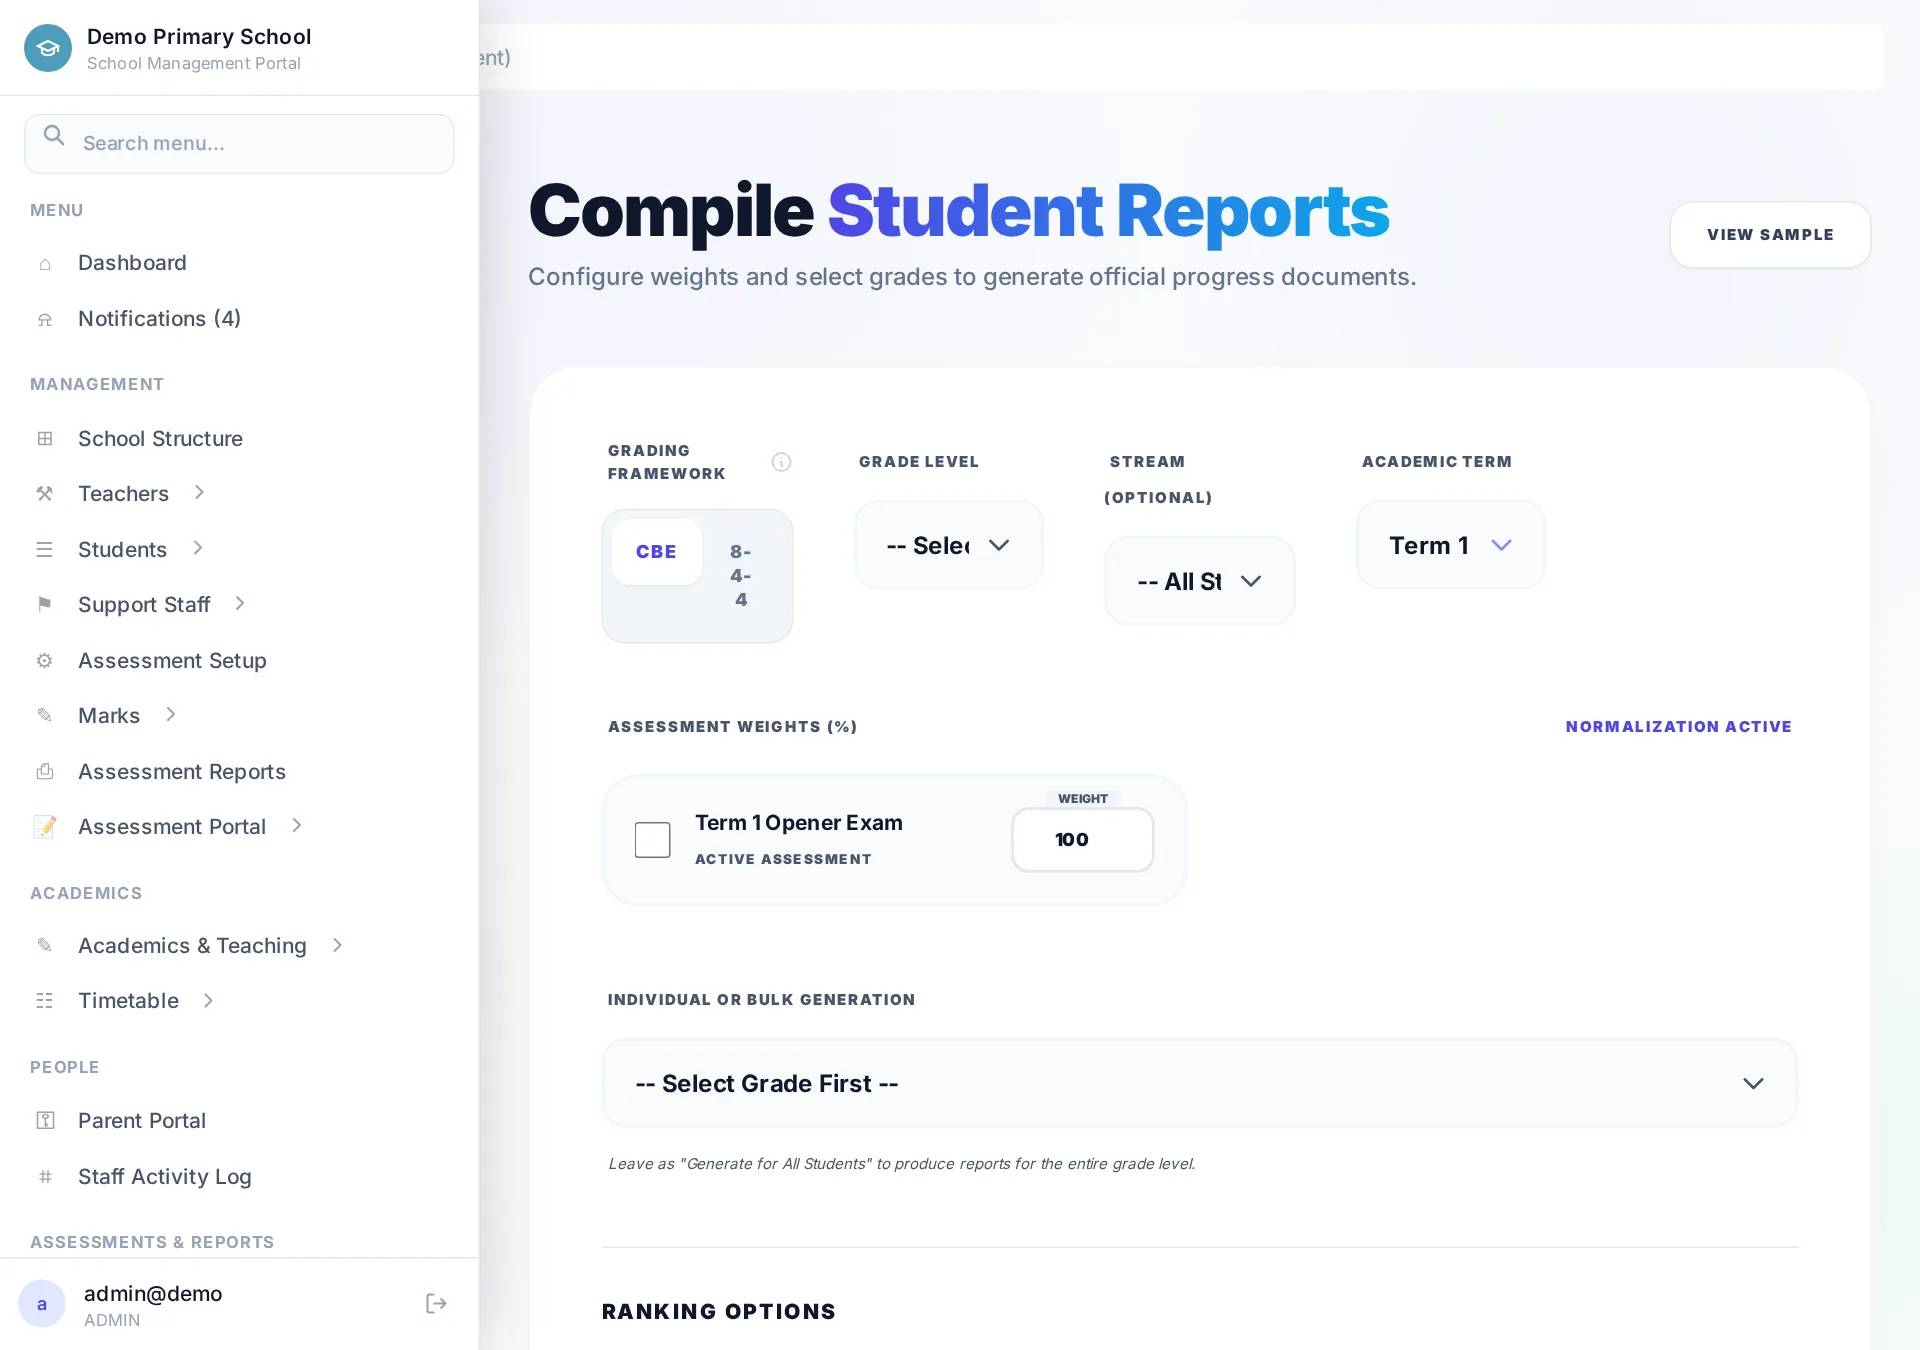
Click Generate Reports. Pick the assessment, class and stream, choose what goes on the card (scores, CBC performance levels, position in class, attendance, conduct, teacher and head-teacher comments), then preview one card before running the whole class.
- Preview — opens one learner's card so you can check layout and data first.
- PDF — print-ready cards, individually or merged for the whole class.
- Excel — the same data as a spreadsheet for analysis or import elsewhere.
- HTML — a browser version you can share or archive.
Cards pull marks from every subject automatically and grade them on the CBC performance scale (Exceeding / Meeting / Approaching / Below Expectation).
4. Broadsheet & raw marks
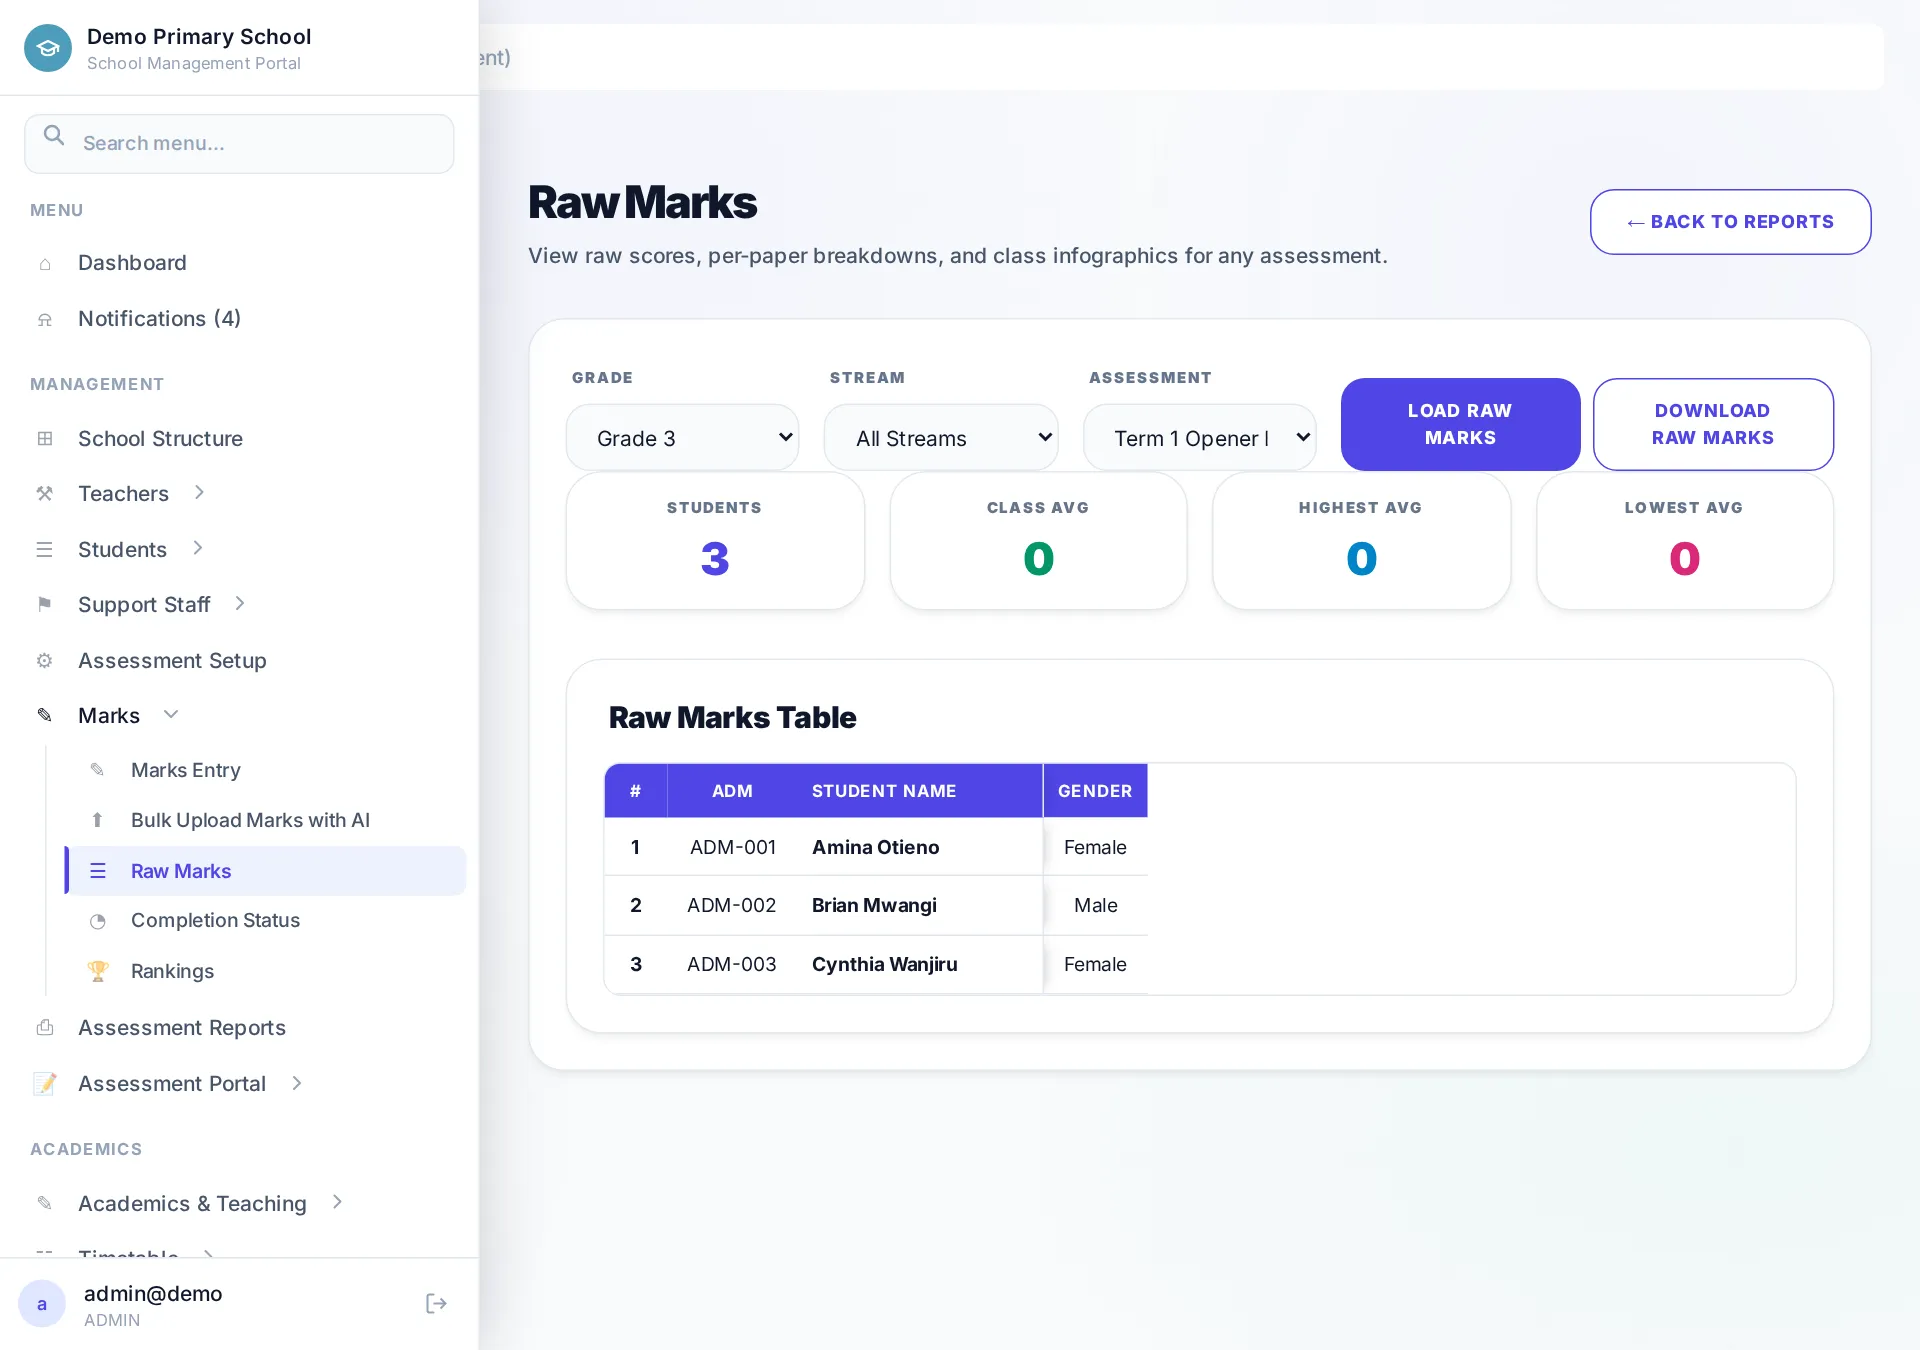
The Broadsheet (Raw Marks report) is the teacher's-eye view of a whole class: every learner down the side, every subject across the top, means and totals computed. Use it to sanity-check marks before cards go out and to spot a subject where the whole class dipped.
5. Rankings
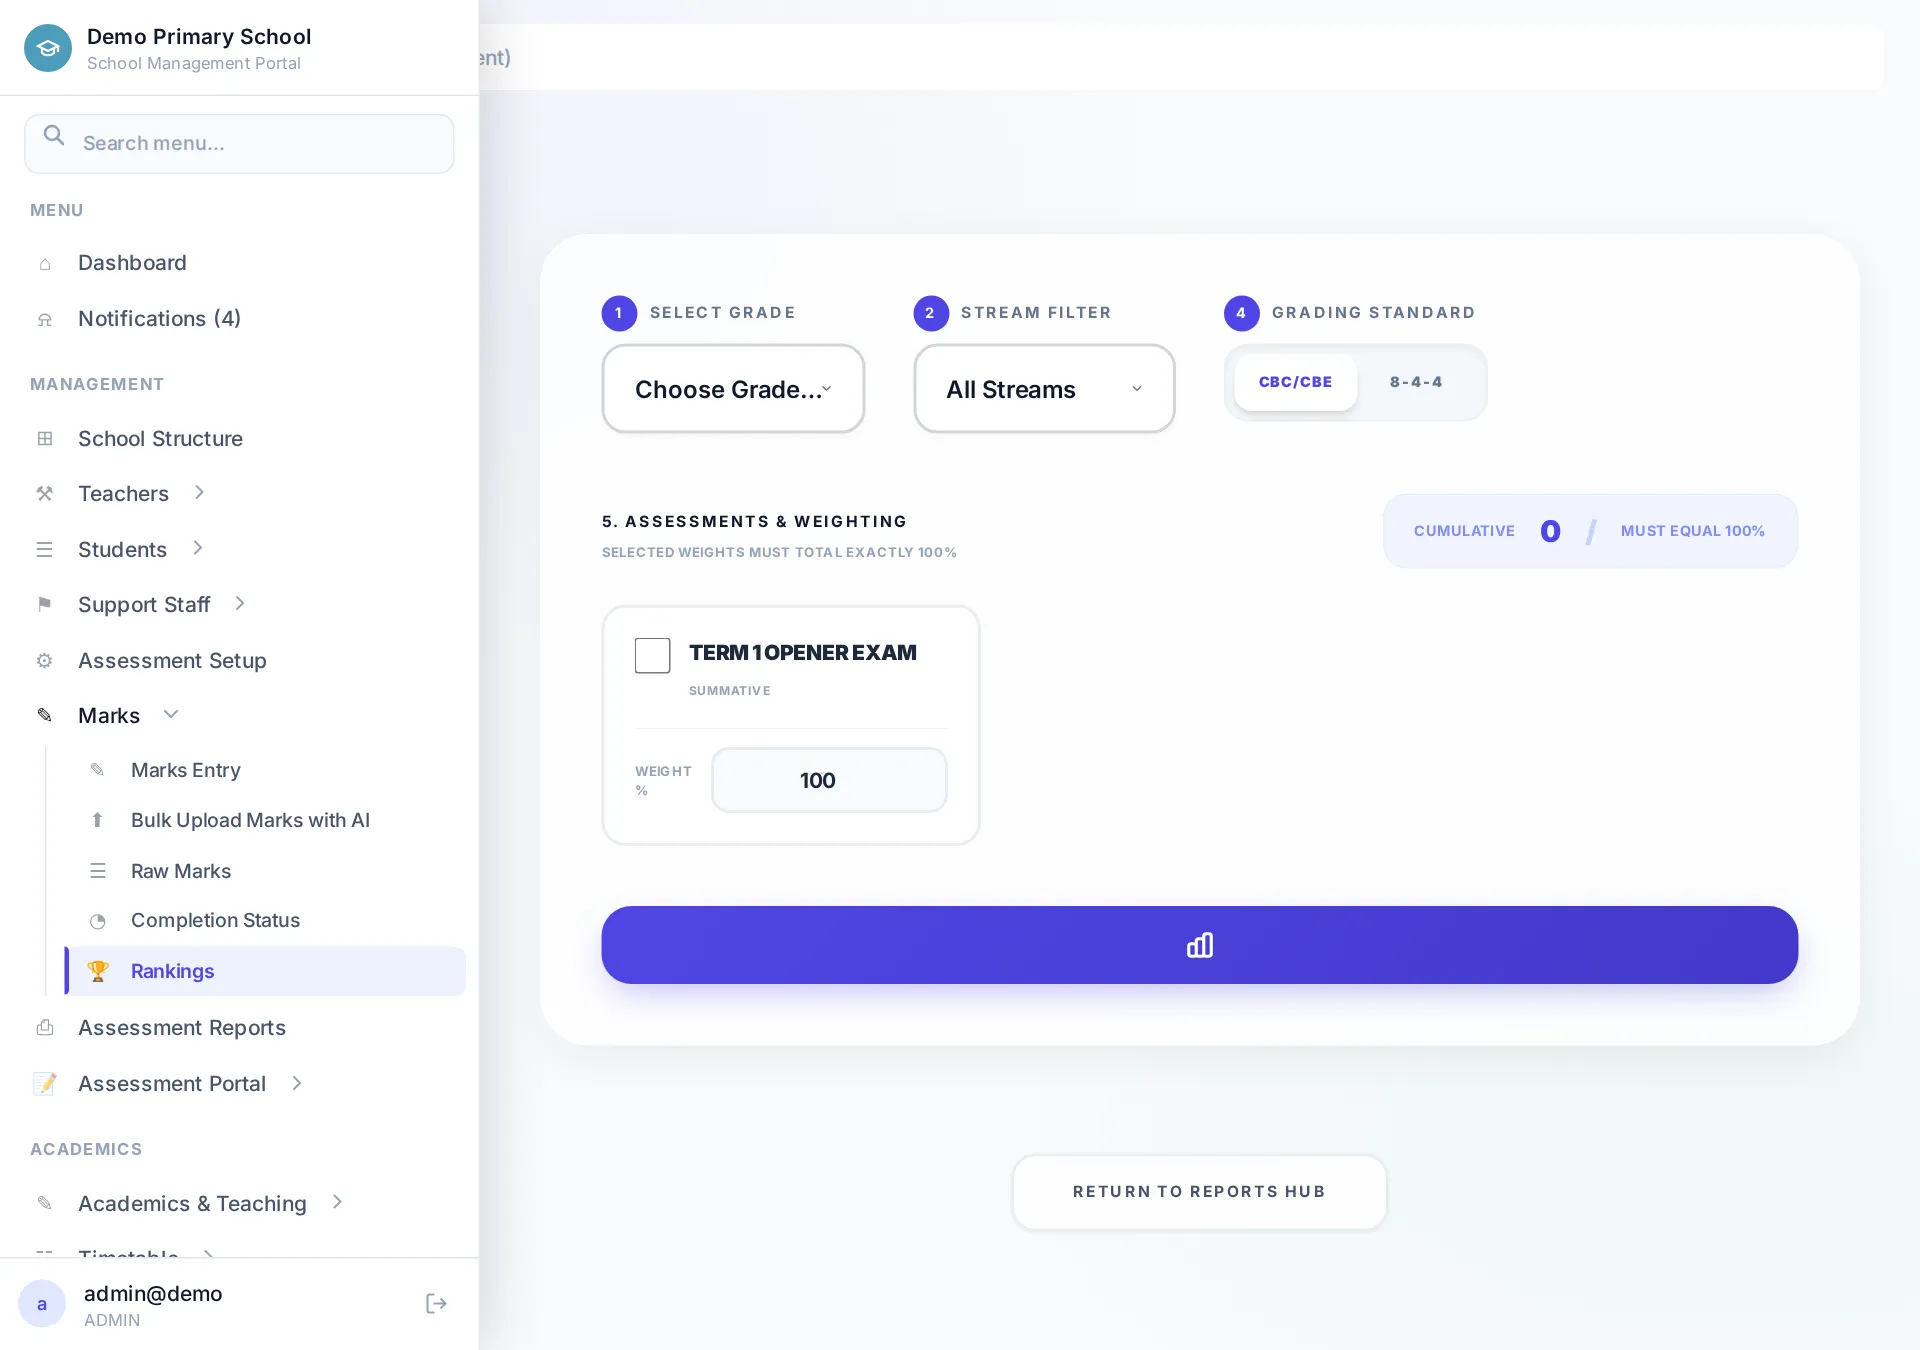
Rankings orders a class or stream by total or mean across one assessment or several combined. Filter by grade, stream or pathway, and switch grading system when comparing across curricula. Useful for prize-giving, identifying top performers, and flagging learners who need support.
6. Progress reports
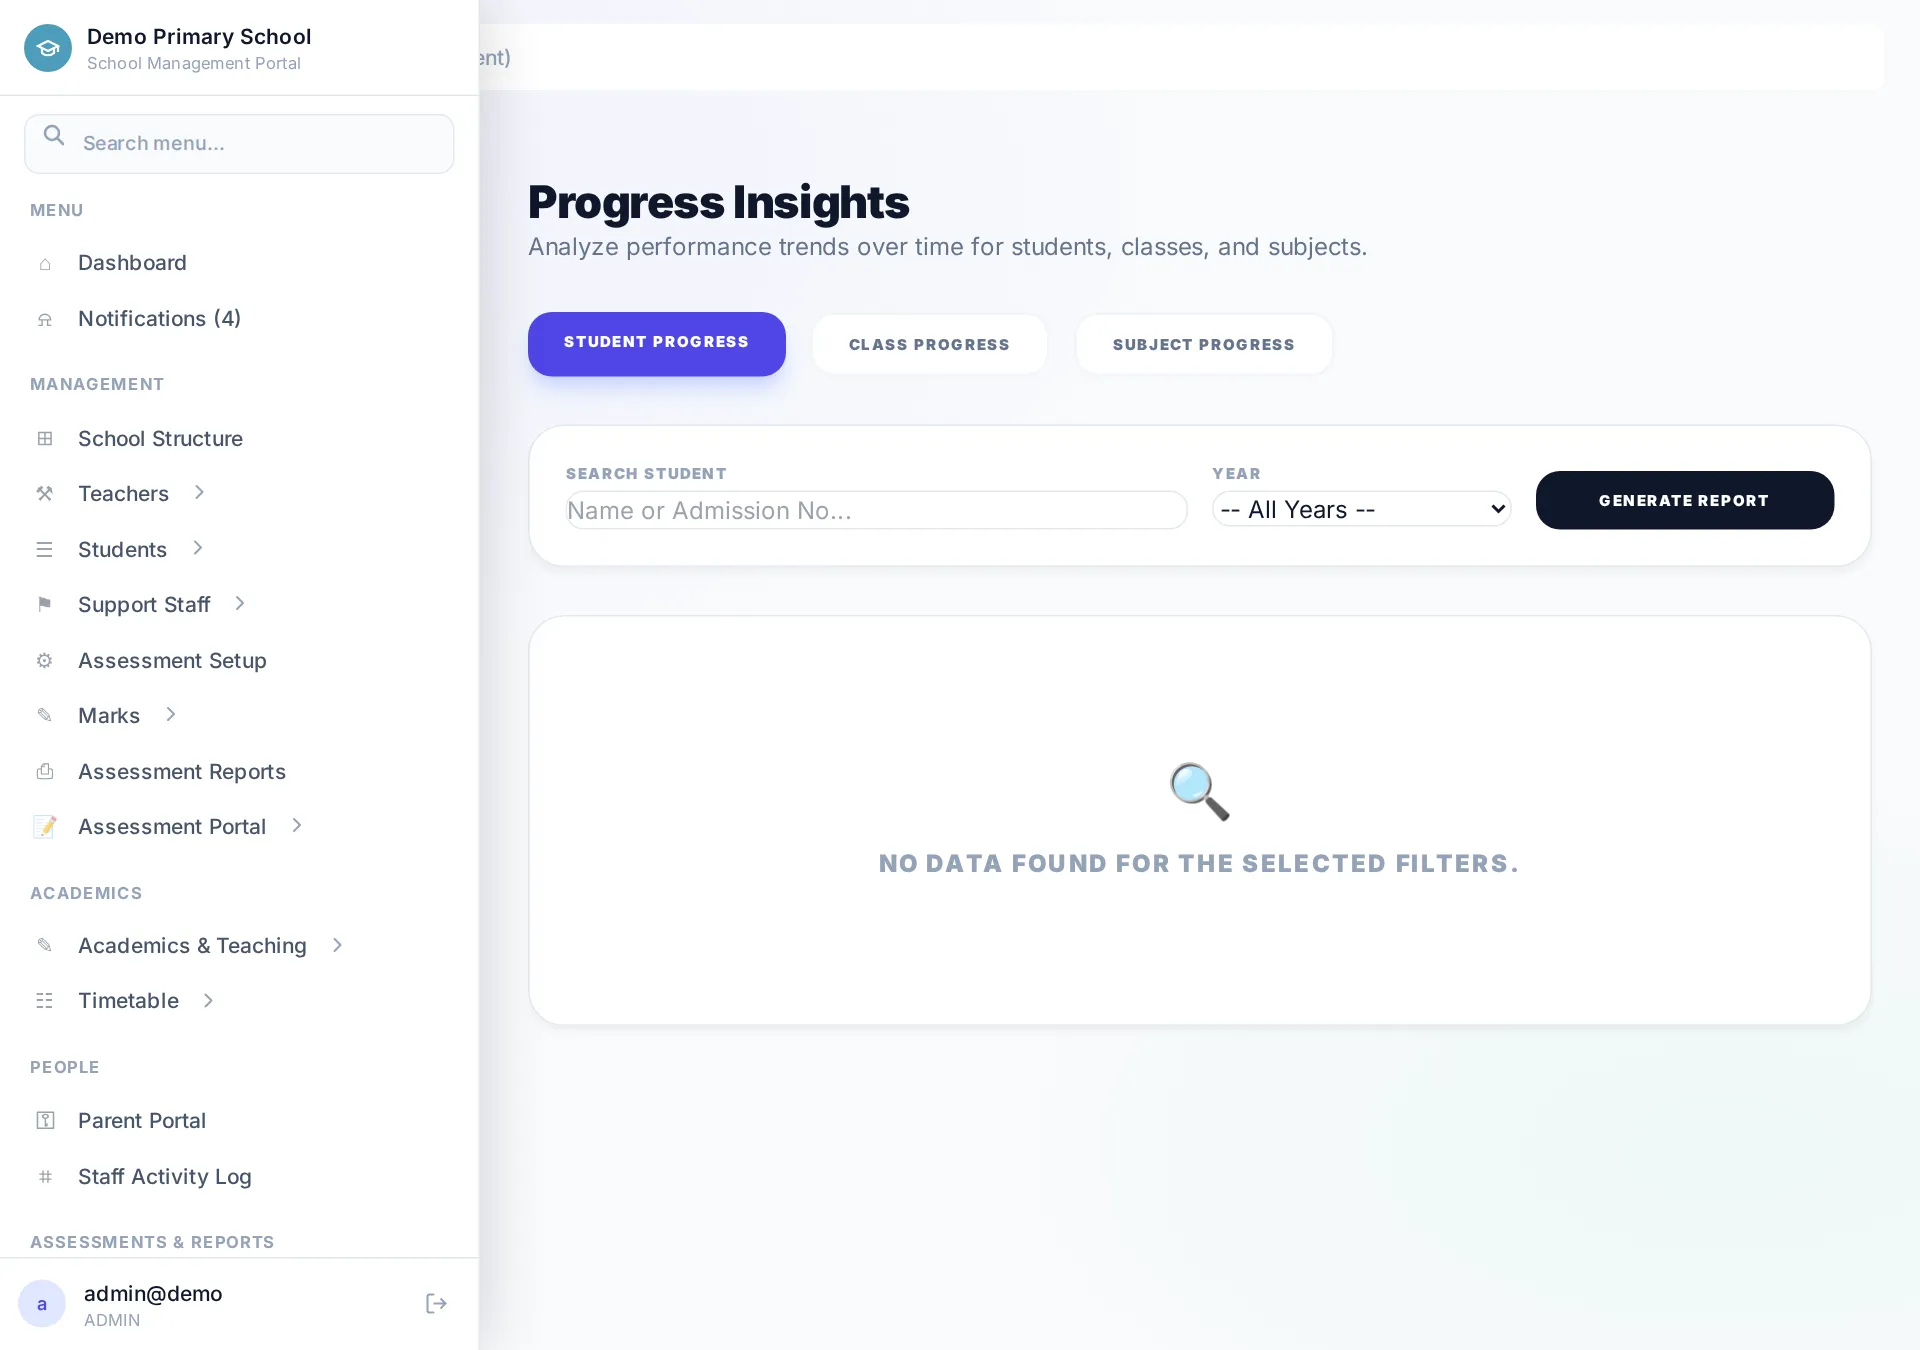
Progress Reports track performance over time — a learner or a subject across assessments and years. This is the report for "how is this student trending?" conversations at parent meetings.
7. Transcripts
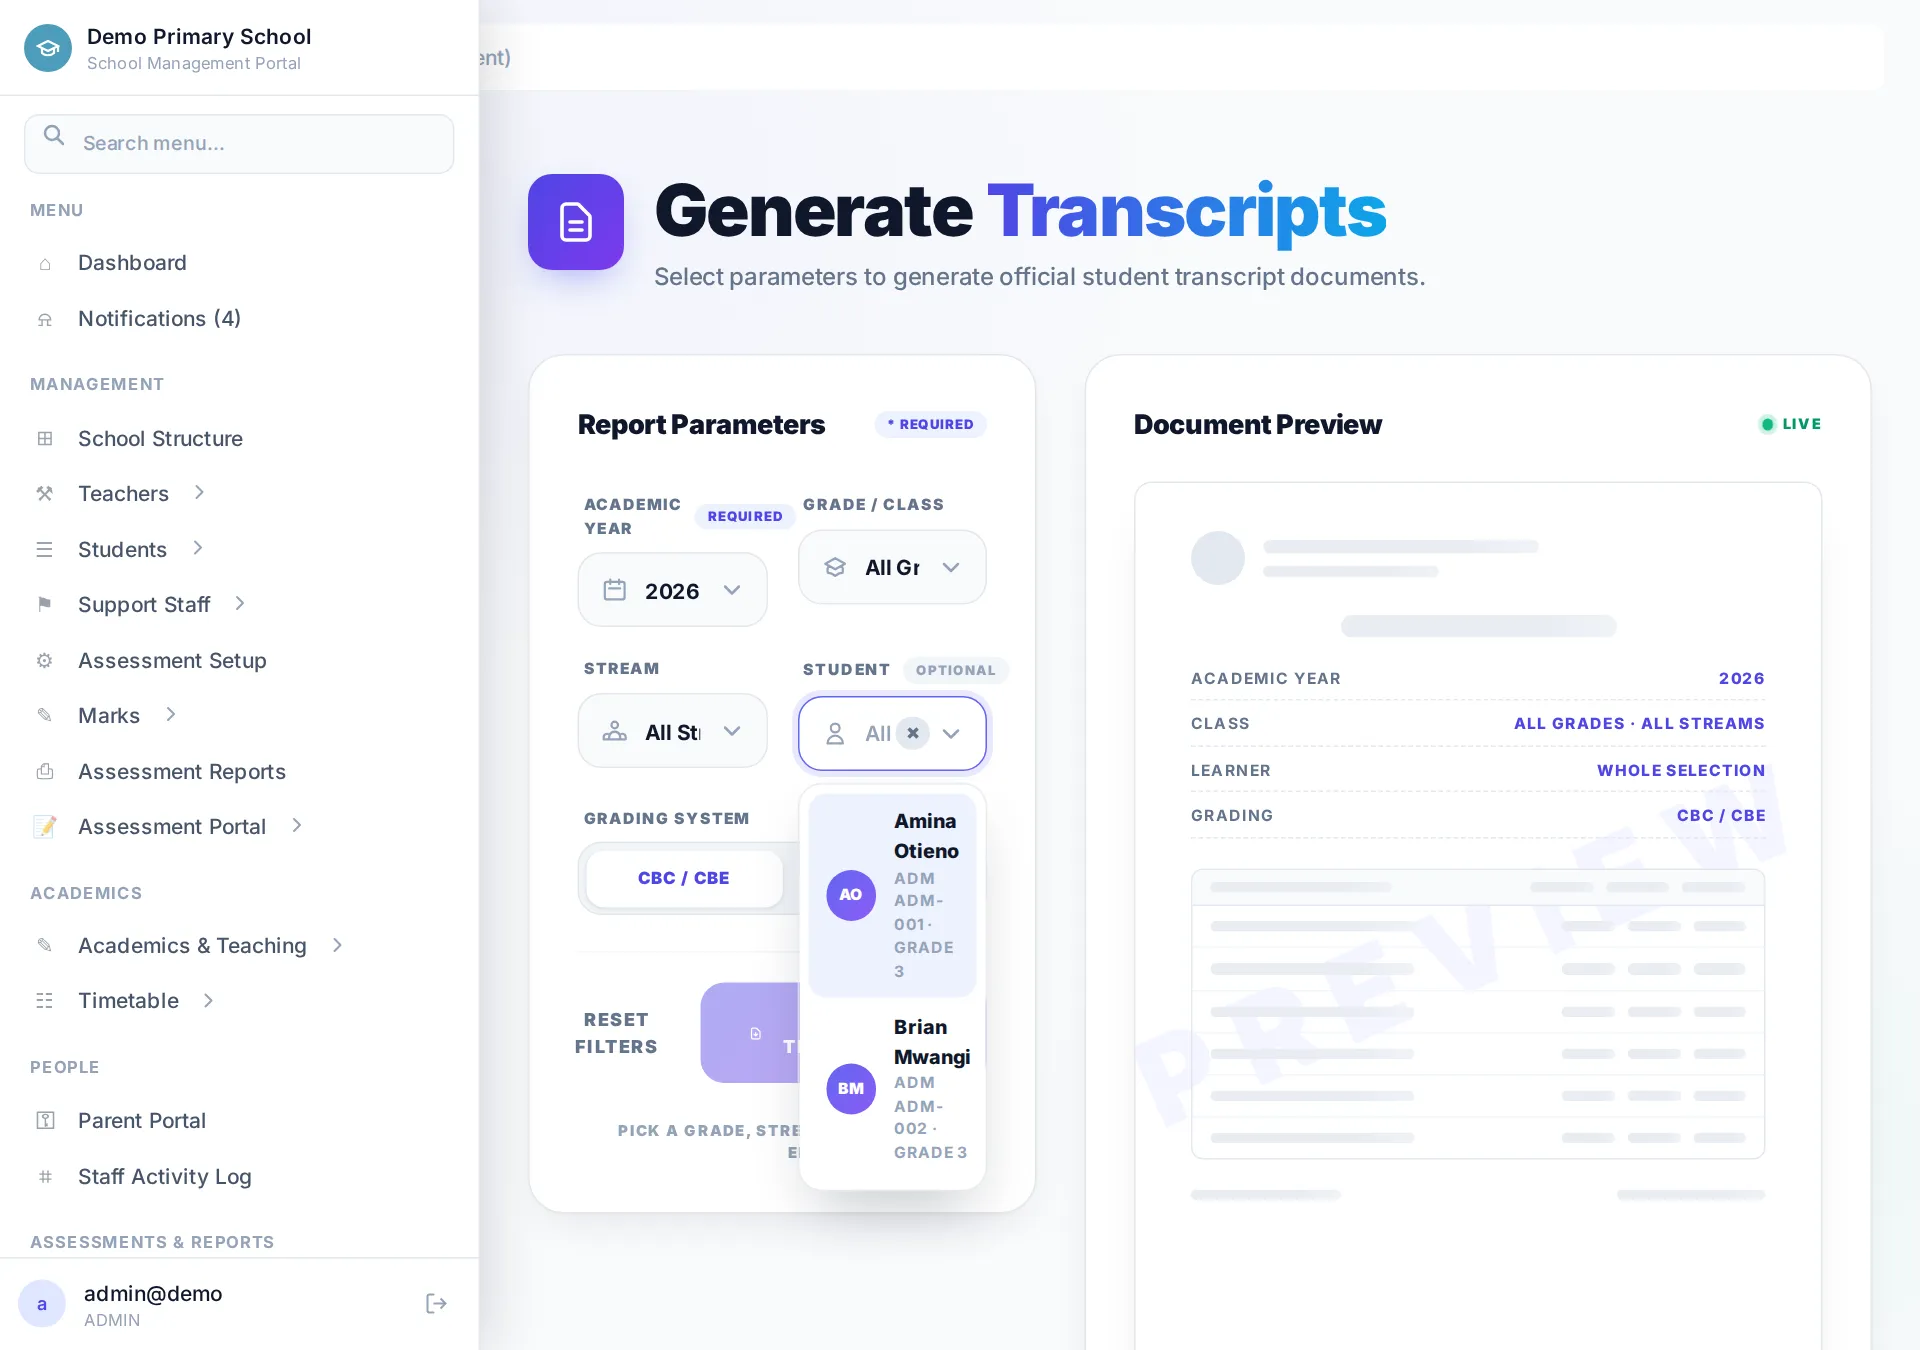
Transcripts compile a learner's complete academic record across years into one official document — the thing a transferring or graduating student actually needs. Select the student and the years to include; the transcript renders with the same school branding.
8. Newsletters
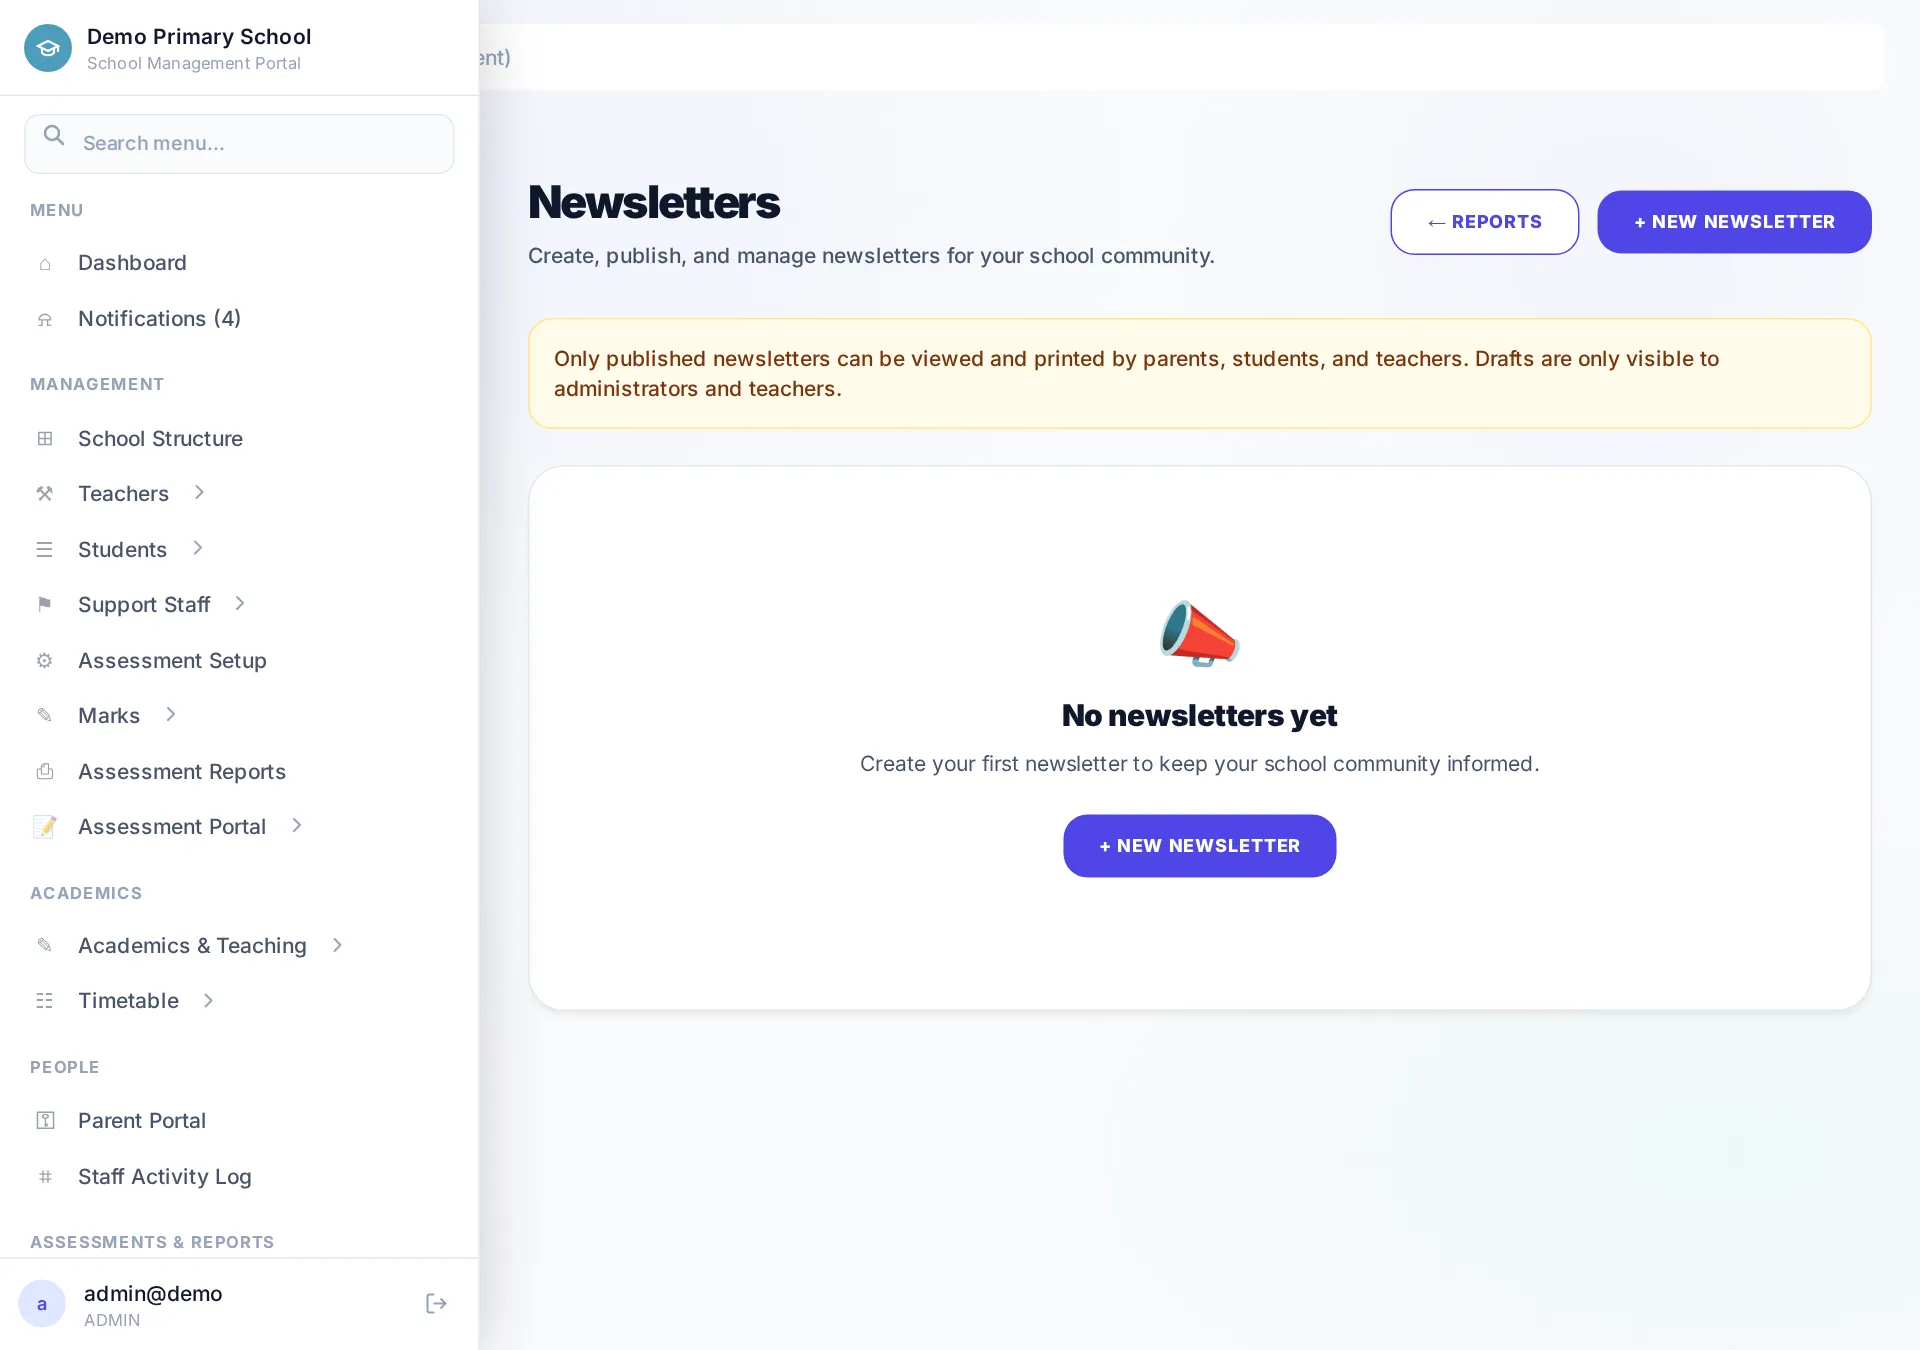
Newsletters lets you write branded school updates — term highlights, exam dates, fee reminders — preview them, then publish. Drafts stay private until published.
9. Marks completion
Covered in detail in Assessments & report cards — Completion Status shows which classes still owe marks per assessment, and Notify Teachers nudges everyone who's behind.
Tips
- Generate a single-card preview before bulk runs — branding issues are much cheaper to catch early.
- Run the broadsheet first; a missing subject column usually means an assignment or marks-entry gap.
- Rankings are admin-only; broadsheets and progress reports are available to teachers for their classes.